This is a sponsored article.
 Seating charts make a real difference to the classroom learning environment in terms of teacher effectiveness and student attainment. Through using a seating chart, the teacher is imposing their authority before the lesson has even begun and making it clear to the students that the classroom is the teacher’s territory and they are in control of it. By using their knowledge of students and putting careful thought into the design of the seating chart the teacher can minimise negative interactions between students and take advantage of peer-to-peer learning strategies.
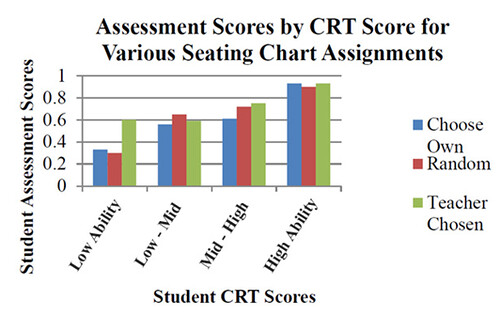
It is a common fear that lower ability students will have a negative impact on the attainment of the high ability students when seated next to each other, but research from Montana State University clearly shows a huge attainment increase for the lower ability students with no detrimental impact on the high ability students, as shown below:
 CRT stands for Criterion Reference Tests, which were used in the research in Montana State.When I was working as a teacher I went through the usual inspection regimes and always tried to do something a little bit extra to impress the inspectors. For the last inspection I shared the concept of adding photos & key data to seating charts and this was taken up whole school. The Assistant Head and an administrator slaved for hours with excel and PowerPoint, creating a seating chart & adding data for each class in the school (with 50 teachers that meant around 800 PowerPoint slides). It was a lot of work but the outcome was that because the teachers were aware of students’ needs and abilities the approach was identified as outstanding practice.
The above thoughts and research led us to build Class Charts from the bottom up and we hope it will have a real impact on classroom management and lead to an improvement in student attainment. Feedback has been superb and since launch in January 2013 we already have 60,000 teachers and 2 million students on the system from around the world and a whole school version is now available.
Here are just some of our Class Charts Whole School features
- Synchronise with SIMS: seamlessly combine seating charts with the power of SIMS- synchronise timetables, students, teachers, rooms and student photos.
- Artificial Intelligence: our AI engine builds profiles of students which are used for analytics and intelligent seating. Trends and patterns of student behaviour are analysed and used to identify students who need support before their behaviour becomes out of hand.
- Gorgeous seating charts: our seating charts are ‘data rich’ with key information such as SEN status, reading age and targets being displayed for each student, giving your staff key data at a glance.
- Easy behaviour management: behaviour issues can be minimised by taking a whole school approach to behaviour and providing all teachers with real time information.
Extract from case Studies
Dave Cookson, Deputy Headteacher at Seaton Burn College:
"We chose Class Charts because it is flexible to the needs of staff and provides the essential contextual information for each student from SIMS.
Couple this with the ability for staff to choose their own data fields and reward/sanction choices means it suits all teachers, age groups and curriculum areas.
The behaviour analytics are excellent for senior leaders to pick up trends and intervene where necessary. We can also trace the impact of those interventions, which is crucial.”
Roy Coulson, Deputy Headteacher, St James’s Church of England High School:
“Staff have embraced Class Charts at our school because it does exactly what they wanted. The job of putting this information together manually, is both onerous and less effective. The visual representation of the data really helps a teacher plan and organise the room to maximise learning opportunities and, if required, make changes quickly and easily. A real winner!”